I’m having trouble keeping up with attestations since the merge. Server has plenty of power, disk and mem, but just cannot keep up. I removed & reinstalled geth completely and it was fine for a couple days. In grafana, I saw ipfs consuming almost all available memory. Could this be the issue? I restarted ipfs and it cut it back, but seems to want to consume as much as possible if extra mem is found (ipfs was using 16Gb ram before I restarted it). Any other suggestions on what to look into? Core i7 w/ 32gb ram, 4tb ssds. Ive turned off all other projects - it’s only geth, prysm and web3signer now - still can’t sync the geth or prysm chains well.
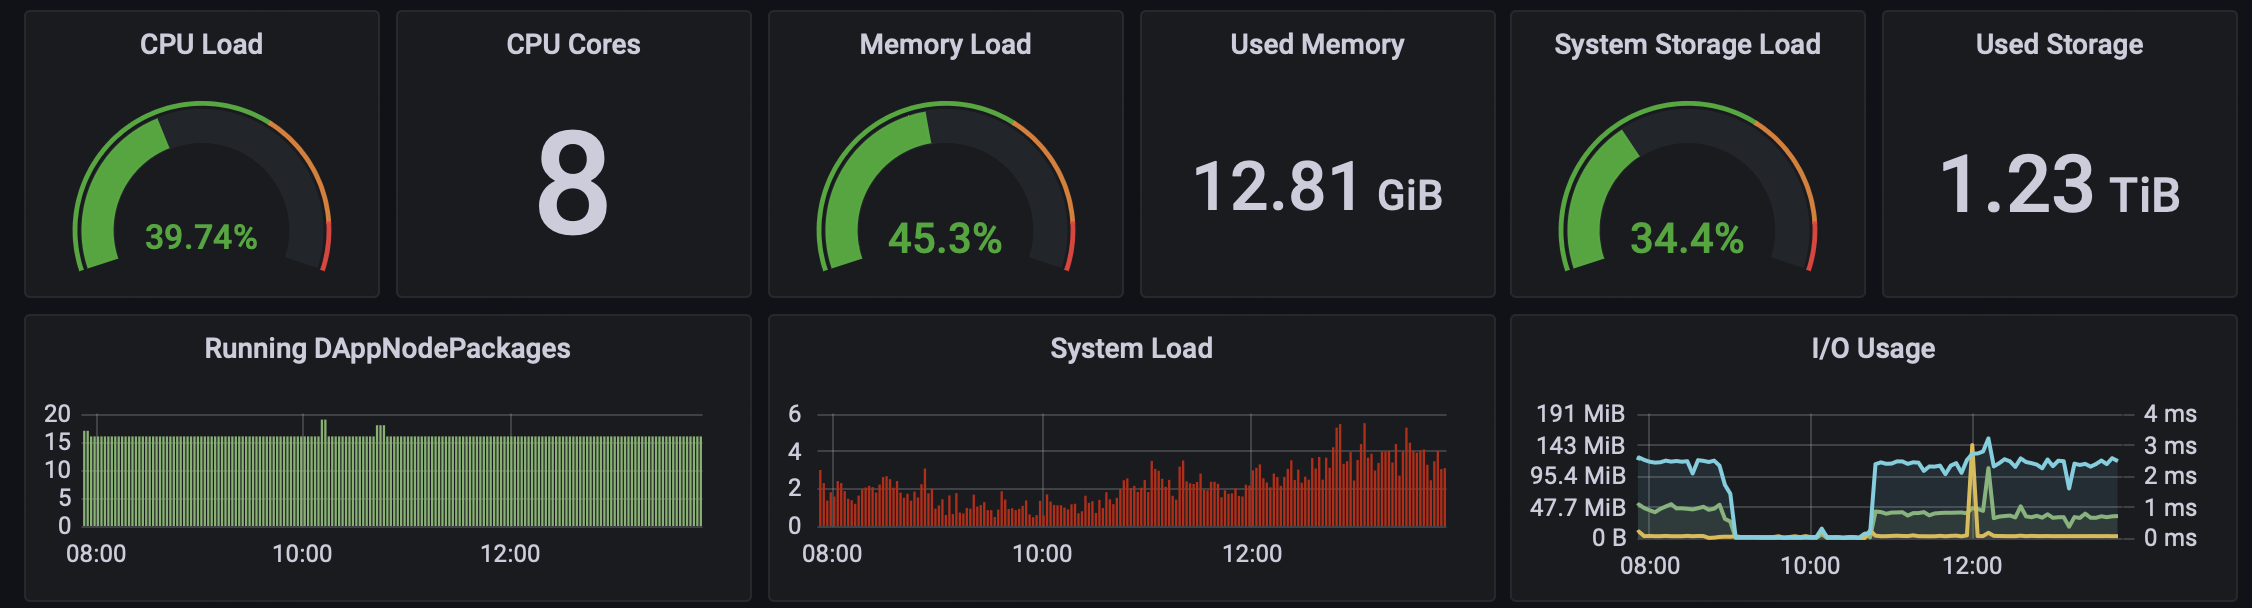
Here’s some pics of grafana. After restarting ipfs, mem usage went down, but it has a slow rise looks like to infinity and beyond. Server was able to catch up and sync both chains and is attesting now. How about switching ipfs to lowpower in config?
looking at the logs in geth, everything goes along just fine until I get this… the goroutines keep going until it looks like geth restarts… anyone know what it means? thx
fatal error: index out of range

runtime stack:
runtime.throw({0x14c10fe?, 0x2091360?})
	runtime/panic.go:992 +0x71
runtime.panicCheck1(0x0?, {0x14c10fe, 0x12})
	runtime/panic.go:35 +0x87
runtime.goPanicIndexU(0xf03028, 0x400000)
	runtime/panic.go:92 +0x34
runtime.heapBitsForAddr(...)
	runtime/mbitmap.go:321
runtime.scanobject(0xc000057238?, 0xc000057238?)
	runtime/mgcmark.go:1246 +0x325
runtime.gcDrain(0xc000057238, 0x7)
	runtime/mgcmark.go:1081 +0x1d4
runtime.gcBgMarkWorker.func2()
	runtime/mgc.go:1295 +0x6e
runtime.systemstack()
	runtime/asm_amd64.s:469 +0x49

goroutine 51 [GC worker (idle)]:
runtime.systemstack_switch()
	runtime/asm_amd64.s:436 fp=0xc00041e758 sp=0xc00041e750 pc=0x468700
runtime.gcBgMarkWorker()
	runtime/mgc.go:1263 +0x1b1 fp=0xc00041e7e0 sp=0xc00041e758 pc=0x41cc51
runtime.goexit()
	runtime/asm_amd64.s:1571 +0x1 fp=0xc00041e7e8 sp=0xc00041e7e0 pc=0x46a921
created by runtime.gcBgMarkStartWorkers
	runtime/mgc.go:1131 +0x25

goroutine 1 [chan receive, 170 minutes]:
github.com/ethereum/go-ethereum/node.(*Node).Wait(...)
	github.com/ethereum/go-ethereum/node/node.go:534
main.geth(0xc00074c040)
	github.com/ethereum/go-ethereum/cmd/geth/main.go:354 +0x15e
github.com/urfave/cli/v2.(*App).RunContext(0xc000102b60, {0x17cc0e8?, 0xc000040060}, {0xc0000b8340, 0x19, 0x1a})
	github.com/urfave/cli/v2@v2.10.2/app.go:350 +0x9d3
github.com/urfave/cli/v2.(*App).Run(...)
	github.com/urfave/cli/v2@v2.10.2/app.go:247
main.main()
	github.com/ethereum/go-ethereum/cmd/geth/main.go:267 +0x47

.........>

goroutine 3971609 [select]:
github.com/ethereum/go-ethereum/core/state.(*subfetcher).loop(0xc046c79930)
	github.com/ethereum/go-ethereum/core/state/trie_prefetcher.go:307 +0x4d8
created by github.com/ethereum/go-ethereum/core/state.newSubfetcher
	github.com/ethereum/go-ethereum/core/state/trie_prefetcher.go:236 +0x1cb
INFO [09-21|17:33:47.897] Starting Geth on Ethereum mainnet...
INFO [09-21|17:33:47.898] Bumping default cache on mainnet         provided=1024 updated=4096
Well, here’s my story for those who may happen upon this thread, as I have been posting errors which now seem related for months. My eth2 node (hades canyon nuc) was lagging for months pre-merge using GETH / PRYSM. I was having lots of errors and could never seem to sync up to the chain, so I was a bit lazy and relied on the dappnode fallback. After the merge, it became way more critical and at first I had intermittent errors and then all out crashes. I re-installed GETH several times, tried completely deleting geth+db and tried resyncing several times, I tried using Nethermind as well, to no avail. It would work for a while and then fall apart - usually ending in GETH continually showing “restarting” with fatal errors. I will include a lot of the common errors I would get in the GETH logs, but the ones I think in retrospect that are telling are the runtime / index out of range errors. Finally after about a month offline- I got around to testing the nvme drives using smartctl and the 2 x 2TB drives tested just fine “SMART overall-health self-assessment test result: PASSED” for both. Next, I tested memory modules 2 x 16GB non-ecc memory with memtester. This is where problems began. I did get intermittent errors in various areas. “61FAILURE: 0x3d3d1d3d3d3d3d3d != 0x3d3d3d3d3d3d3d3d at offset 0x34efa2b00.” or “sok”. Then I tested 1 module at a time and both seemed ok, but I did get one ‘sok’. Memtester says to be wary of any anomalies or intermittent errors. This was after 7 loops of memtester for each scenario which took about 3 days in total. In the end, I eliminated the slightly suspect stick of ram, but in the end, I’m not sure if it’s the stick or perhaps the 2nd ram slot that may be at fault. Anyway, removing this stick of ram and reinstalling GETH has seemed to fix the issue and validator is now attesting!! I hope this helps someone else out there that may have struggled with obscure errors in GETH and I have struggled with this for a long time. My searches turned up random posts but never any solutions or much response or activity. Try memtester. And, for me, another lesson learned is to go with ECC memory as both of these are non-ECC. And, GETH and/or Go needs high-perfoming ram. I will definitely look to upgrade with that in the future, although to be honest, I did not isolate the error absolutely to the ram itself (could be slot 2). For now, I’m up and running finally!!
If I run into any other issues, I will update this thread. Best of luck-
Here are a sampling of common errors I would get in GETH and PRYSM logs:
in GETH logs:

ERROR Unhandled trie error: missing trie node
ERROR Unhandled trie error: missing trie node
ERROR Unhandled trie error: missing trie node
ERROR Unhandled trie error: missing trie node

fatal error: index out of range

runtime stack:

fatal error: index out of range

runtime stack:

fatal error: index out of range

runtime stack:

########## BAD BLOCK #########
########## BAD BLOCK #########
########## BAD BLOCK #########


Error: invalid merkle root
Error: invalid merkle root
Error: invalid merkle root


runtime: marked free object in span
runtime: marked free object in span
runtime: marked free object in span


0xc0f8032390 free  unmarked
0xc0f80323a8 alloc marked
0xc0f80323c0 free  unmarked
0xc0f80323d8 alloc marked
0xc0f80323f0 free  unmarked
0xc0f8032408 alloc marked
0xc0f8032420 free  unmarked
0xc0f8032438 free  marked   zombie
0x000000c0f8032438:  0x000000c0cbebb880  0x0000000000000020
0x000000c0f8032448:  0x0000000000000020
0xc0f8032450 free  unmarked
0xc0f8032468 alloc marked
0xc0f8032480 alloc marked
0xc0f8032498 alloc marked
0xc0f80324b0 alloc marked
0xc0f80324c8 alloc marked
0xc0f80324e0 alloc marked
0xc0f80324f8 alloc marked
0xc0f8032510 alloc marked
0xc0f8032528 free  unmarked


Cleaning spurious beacon sync leftovers
Cleaning spurious beacon sync leftovers
Cleaning spurious beacon sync leftovers

Failed to clean stale beacon headers
Failed to clean stale beacon headers
Failed to clean stale beacon headers


fatal error: found bad pointer in Go heap (incorrect use of unsafe or cgo?)
fatal error: found bad pointer in Go heap (incorrect use of unsafe or cgo?)
fatal error: found bad pointer in Go heap (incorrect use of unsafe or cgo?)


in PRYSM logs:

level=error msg="Failed to update assignments" error="rpc error: code = Unavailable desc = Syncing to latest head, not ready to respond" prefix=validator
level=error msg="Could not check if validators are exited" error="rpc error: code = Unavailable desc = Syncing to latest head, not ready to respond" prefix=validator